
Most active claimants
Introduction
As a part of HOYNG ROKH MONEGIER’s series on statistics on the Unified Patent Court (UPC), this overview presents an analysis on nationalities of claimants and defendants as well as industry trends.
The dataset was collected by 30 March 2026 and reflects publicly available decisions on the UPC registry. The data is drawn from the UPC's public registry and is intended to reflect observable patterns.
The analysis is structured around five main topics:
the identity of the most frequently litigating claimants, and the number of cases filed by these claimants;
the geographic origin of claimants by legal entity and by headquarters location;
the geographic origin of defendants;
the patent classification categories generating the greatest volume of litigation; and
the distribution of claimants' forum preferences across the UPC's local divisions.
1. Most active claimants
1.1 Overview
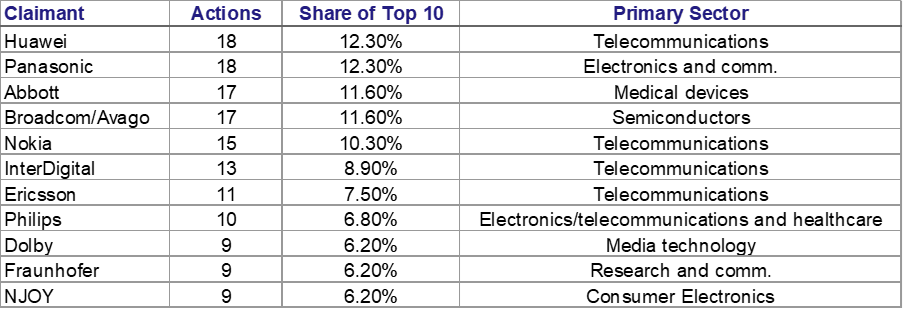
Across filed actions before the Court of First Instance, the ten corporate groups listed below account for a high share of litigation activity. The analysis below covers infringement and revocation actions, declarations of infringement, and applications for provisional measures.
At the relevant date, Huawei and Panasonic each led with 18 actions, followed by Abbott and Broadcom with 17 actions each, and Nokia with 15 actions. InterDigital, Ericsson, Philips, Dolby, Fraunhofer, and NJOY follow suit with between 9 and 13 actions each.
1.2 Industry concentration
The top ten claimants fall largely into two sectors: telecommunications focused entities with standard essential patents (SEPs), and medical device and healthcare. Huawei, Panasonic, Nokia, InterDigital, Ericsson, Broadcom/Avago, Philips, Dolby, and Fraunhofer are each associated wireless communications technology. Abbott and NJOY focus on medical devices and consumer electronics.
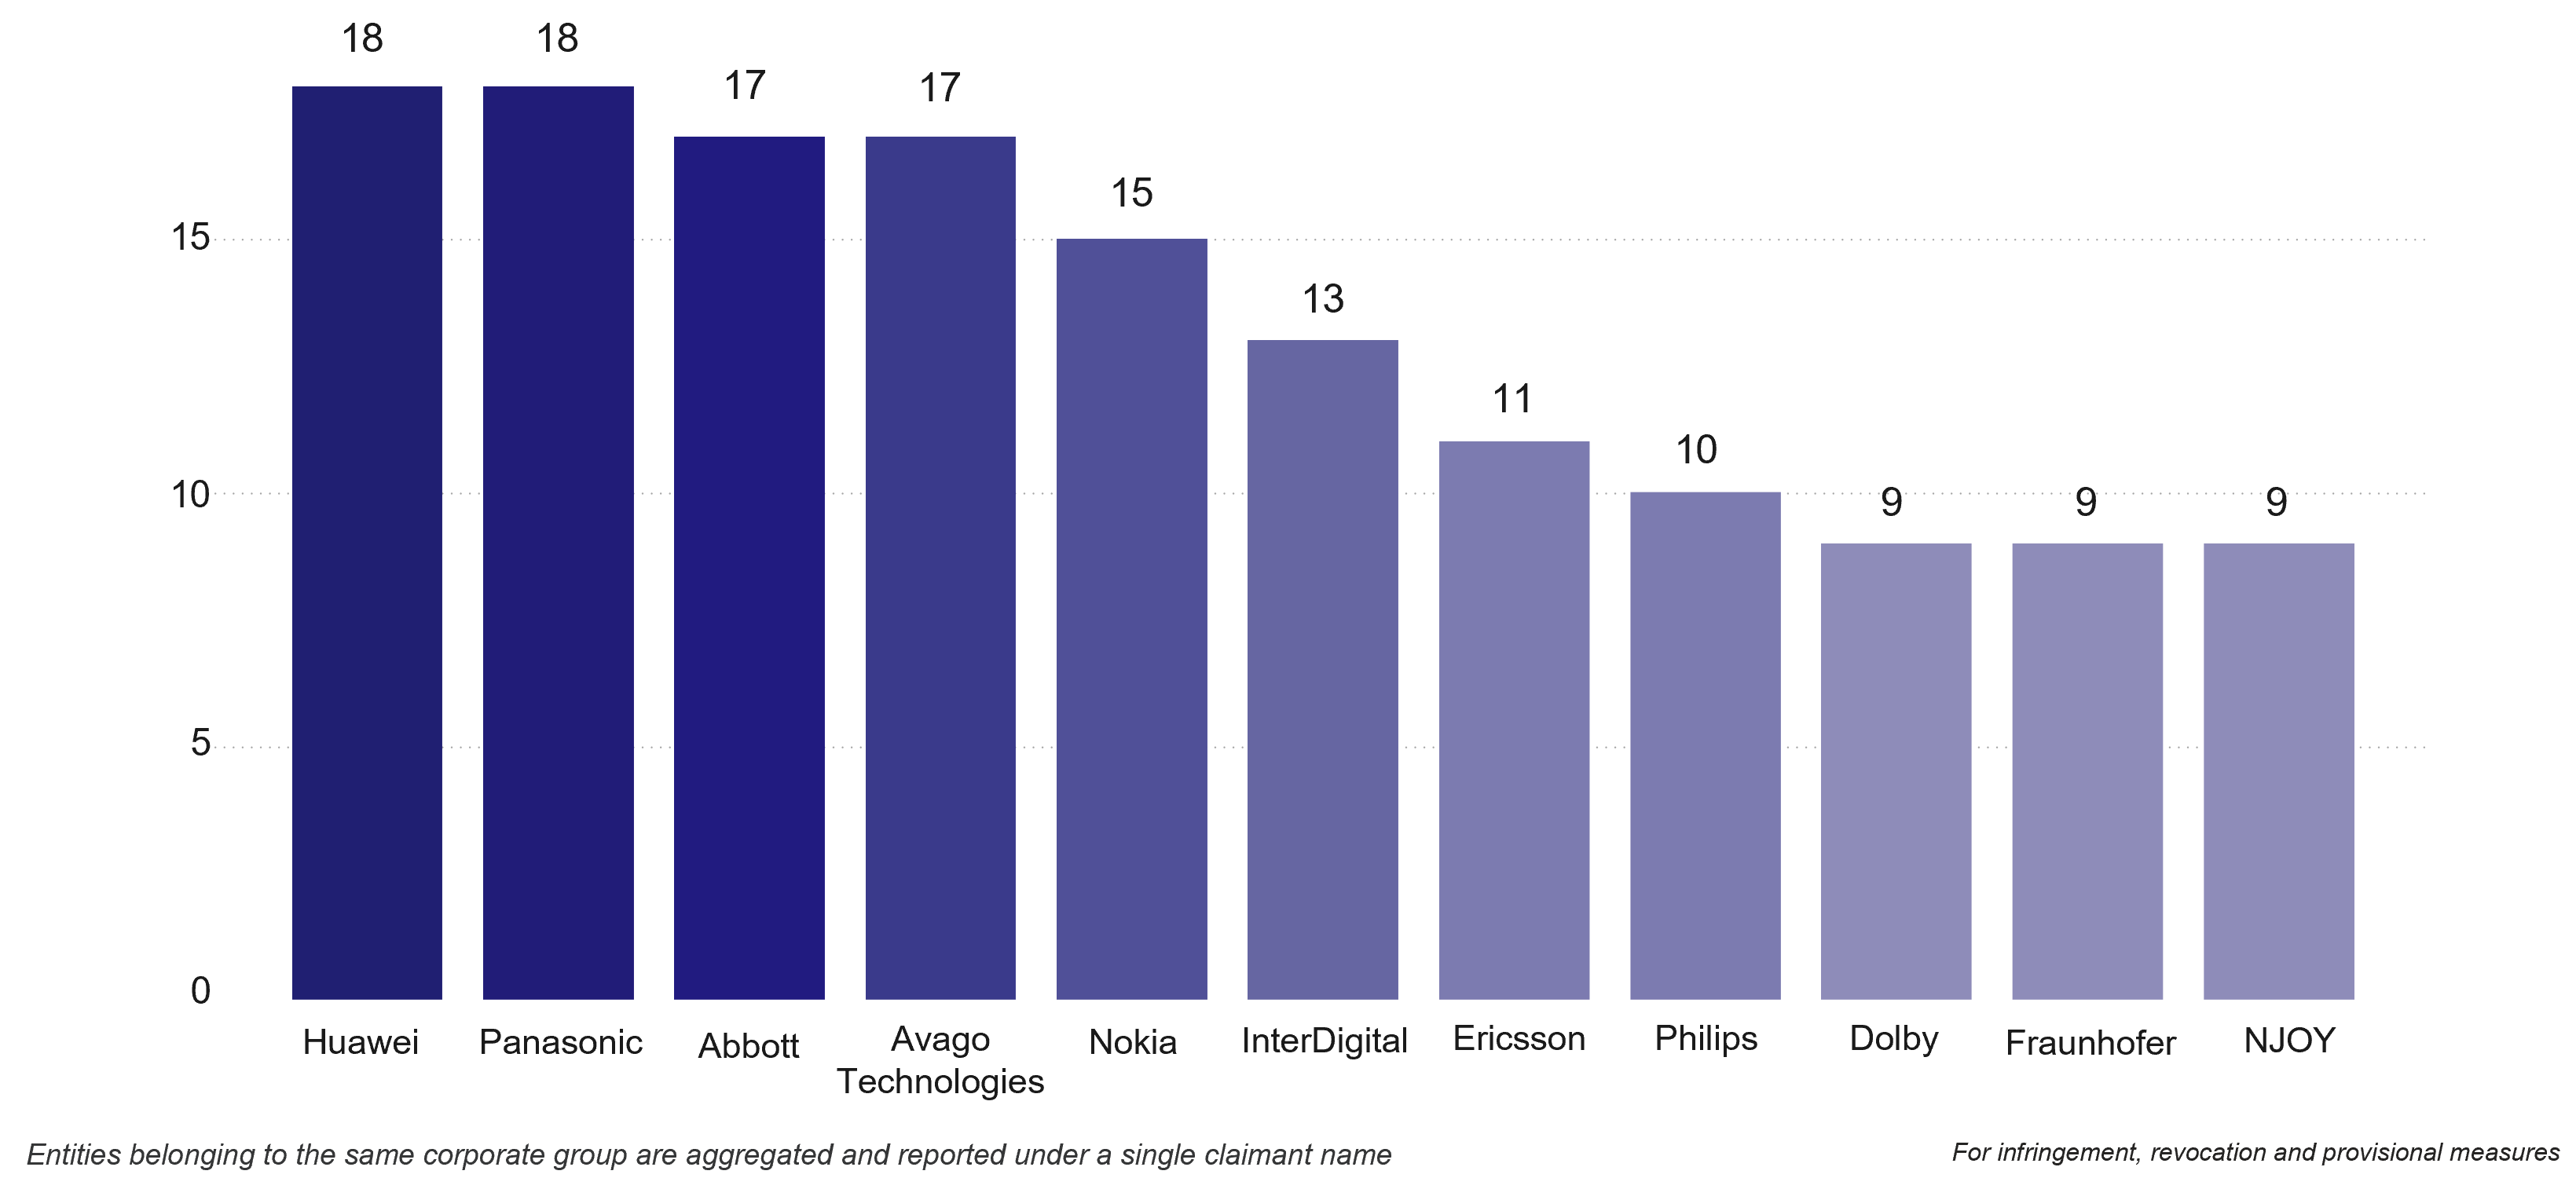
Figure 1. Top 10 claimants
2. Nationalities of claimants
2.1 Geographic distribution by legal entity
Out of 1010 claimant legal entities, 62% are registered in European jurisdictions. North American entities account for 22% and Asian entities for 16%. Oceanian and South American entities together represent a negligible share of the total.
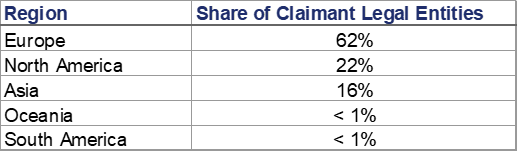
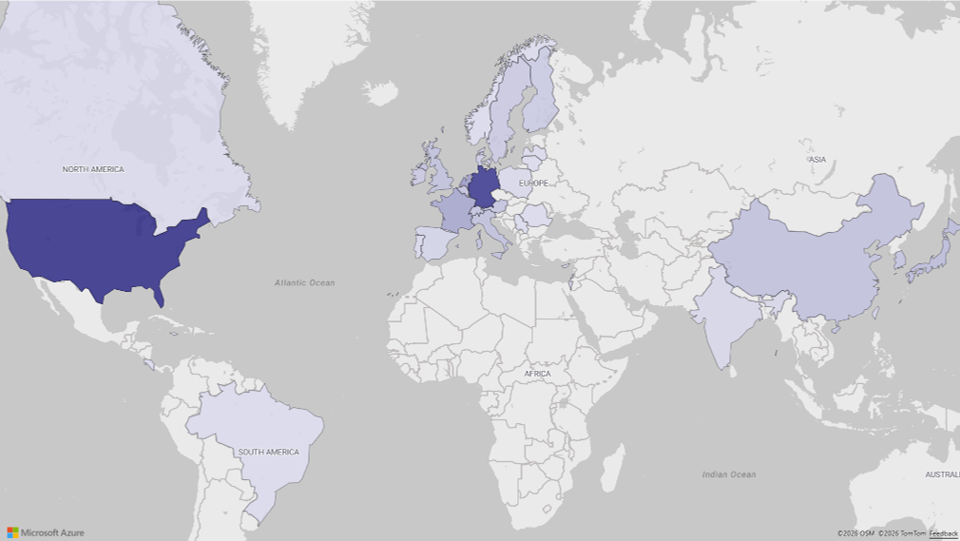
Figure 2.1. Nationalities by legal entity
The presence of European legal entities as claimants is expected given that the UPC operates as a European court with jurisdiction over European and unitary patents. European legal entities arguably have the most immediate interest in the court's territorial scope and are most frequently incorporated in member states or other European countries that make it procedurally easy to bring proceedings as a claimant.
2.2 Geographic distribution by location of headquarters
When claimants are classified by the location of their headquarters rather than by the jurisdiction of incorporation of the specific legal entity, the distribution shifts slightly. The European share of companies falls from 62% to 52%, whilst North America rises from 22% to 29%. Asia’s share increases from 16% to 19%.
Claimants were aggregated by ultimate corporate group rather than individual legal entity. Where an infringement action involved multiple subsidiaries under a single corporate group, the group was recorded as a single unique unit per case. Geographic attribution is determined by the location of the corporate headquarters.
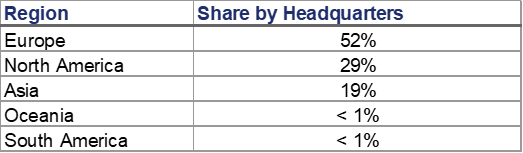
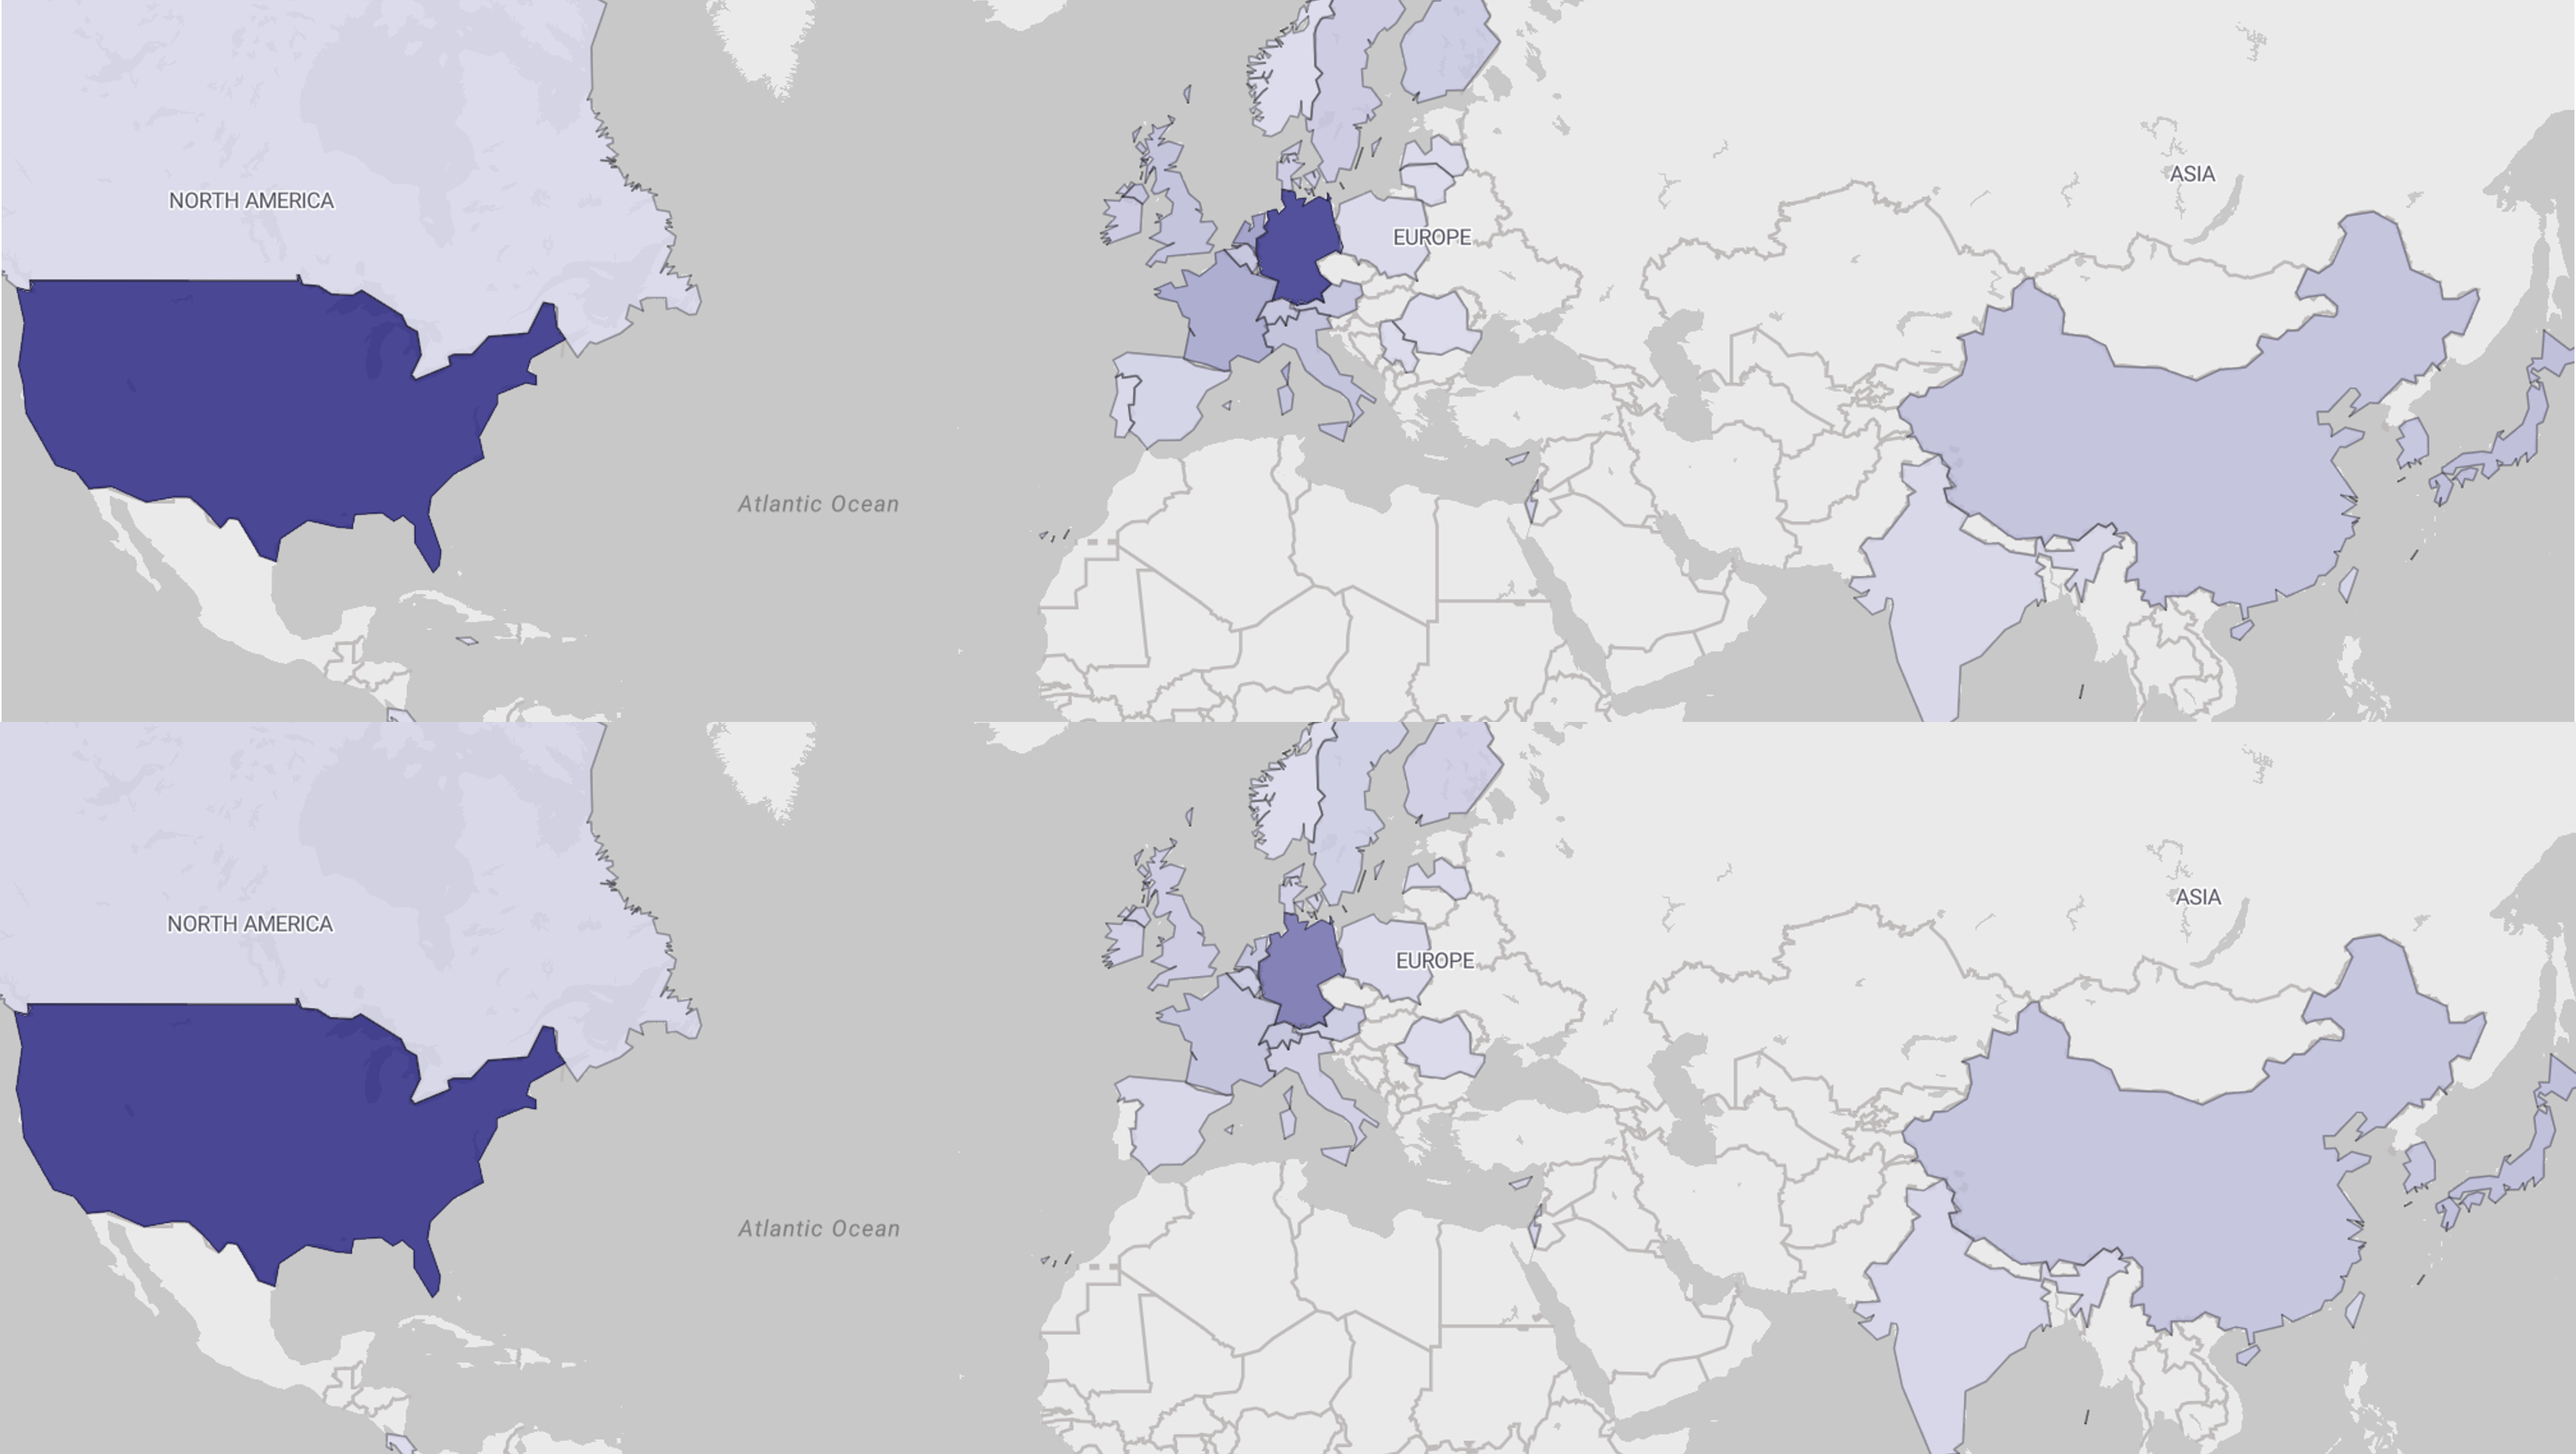
Figure 2.2. Nationalities by headquarter
2.3 Divergence in nationalities
The difference in Europe-based claimants between graphs 2.1 and 2.2 suggests that a portion of non-European corporations (largely North American and Asian), conduct UPC litigation through European subsidiary or affiliate entities incorporated in European jurisdictions.
The seven-percentage point increase in North American representation when measured by headquarters (22% to 29%) suggests that US-based groups maintain European legal entities through which they litigate at the UPC. A similar trend is visible for Asian multinationals, though at a lower rate (16% to 19%).
3. Nationalities of defendants
3.1 Geographic Distribution
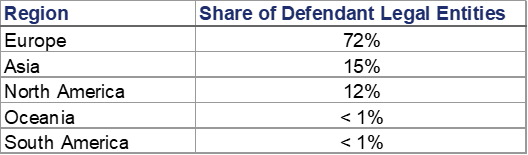
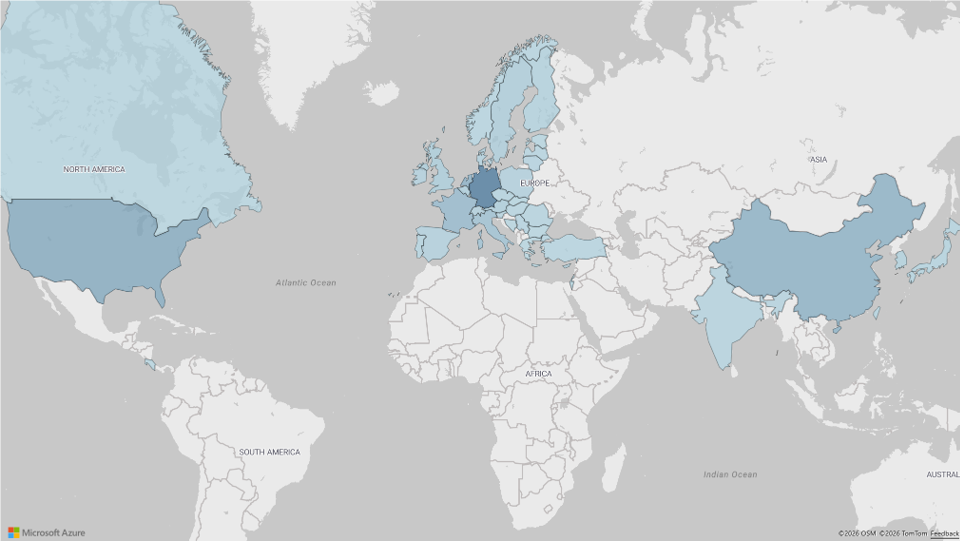
Of 2624 defendant legal entities, 72% are European, 15% Asian, and 12% North American. The remainder, consisting of entities from Oceania and South America, is negligible as a proportion of the total.
3.2 Nationalities of claimants versus defendants
At the legal-entity level, the geographic data indicates a slight imbalance between claimants and defendants. European entities represent 62% of claimants by legal entity but 72% of defendants. In contrast, North America represents 22% of claimants but only 12% of defendants, and Asia represents 16% of claimants but 15% of defendants.
The large share of European entities on the defendant side relative to the claimant side reflects that the UPC's jurisdictional scope is primarily exercised against legal entities selling or distributing products within its member states.
4. Industries with the most litigation
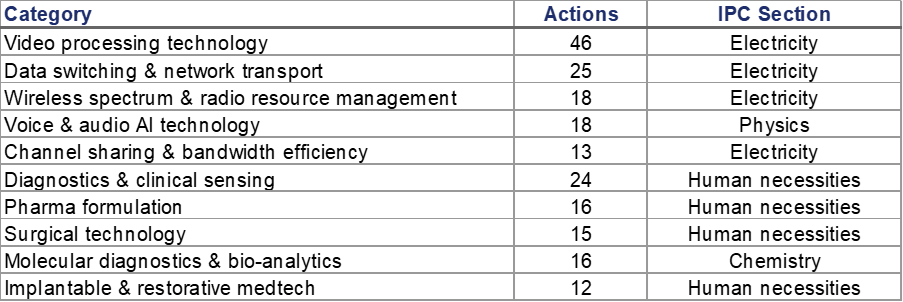
The data covers the top ten patent categories by patent count at the Court of First Instance, classified by six-character International Patent Classification (IPC) code accuracy (e.g., H04N19). The leading category is video processing technology, with 46 patent appearances. Data switching and network transport follows at 25 instances. Both wireless spectrum/radio resource management and AI technology account for 18 patent appearances. Channel sharing and bandwidth efficiency totals 13 appearances.
In the human necessities section, diagnostics and clinical sensing leads at 24 appearances, followed by pharma formulation and surgical technology. Implantable and restorative medtech follows at 12 patent appearances. In the chemistry section, molecular diagnostics and bio-analytics accounts for 16 instances.
The four electricity-section categories together account for 102 patent appearances which makes it the largest source of UPC litigation. This finding is consistent with the prominence of telecommunications and digital media companies among the most active claimants.
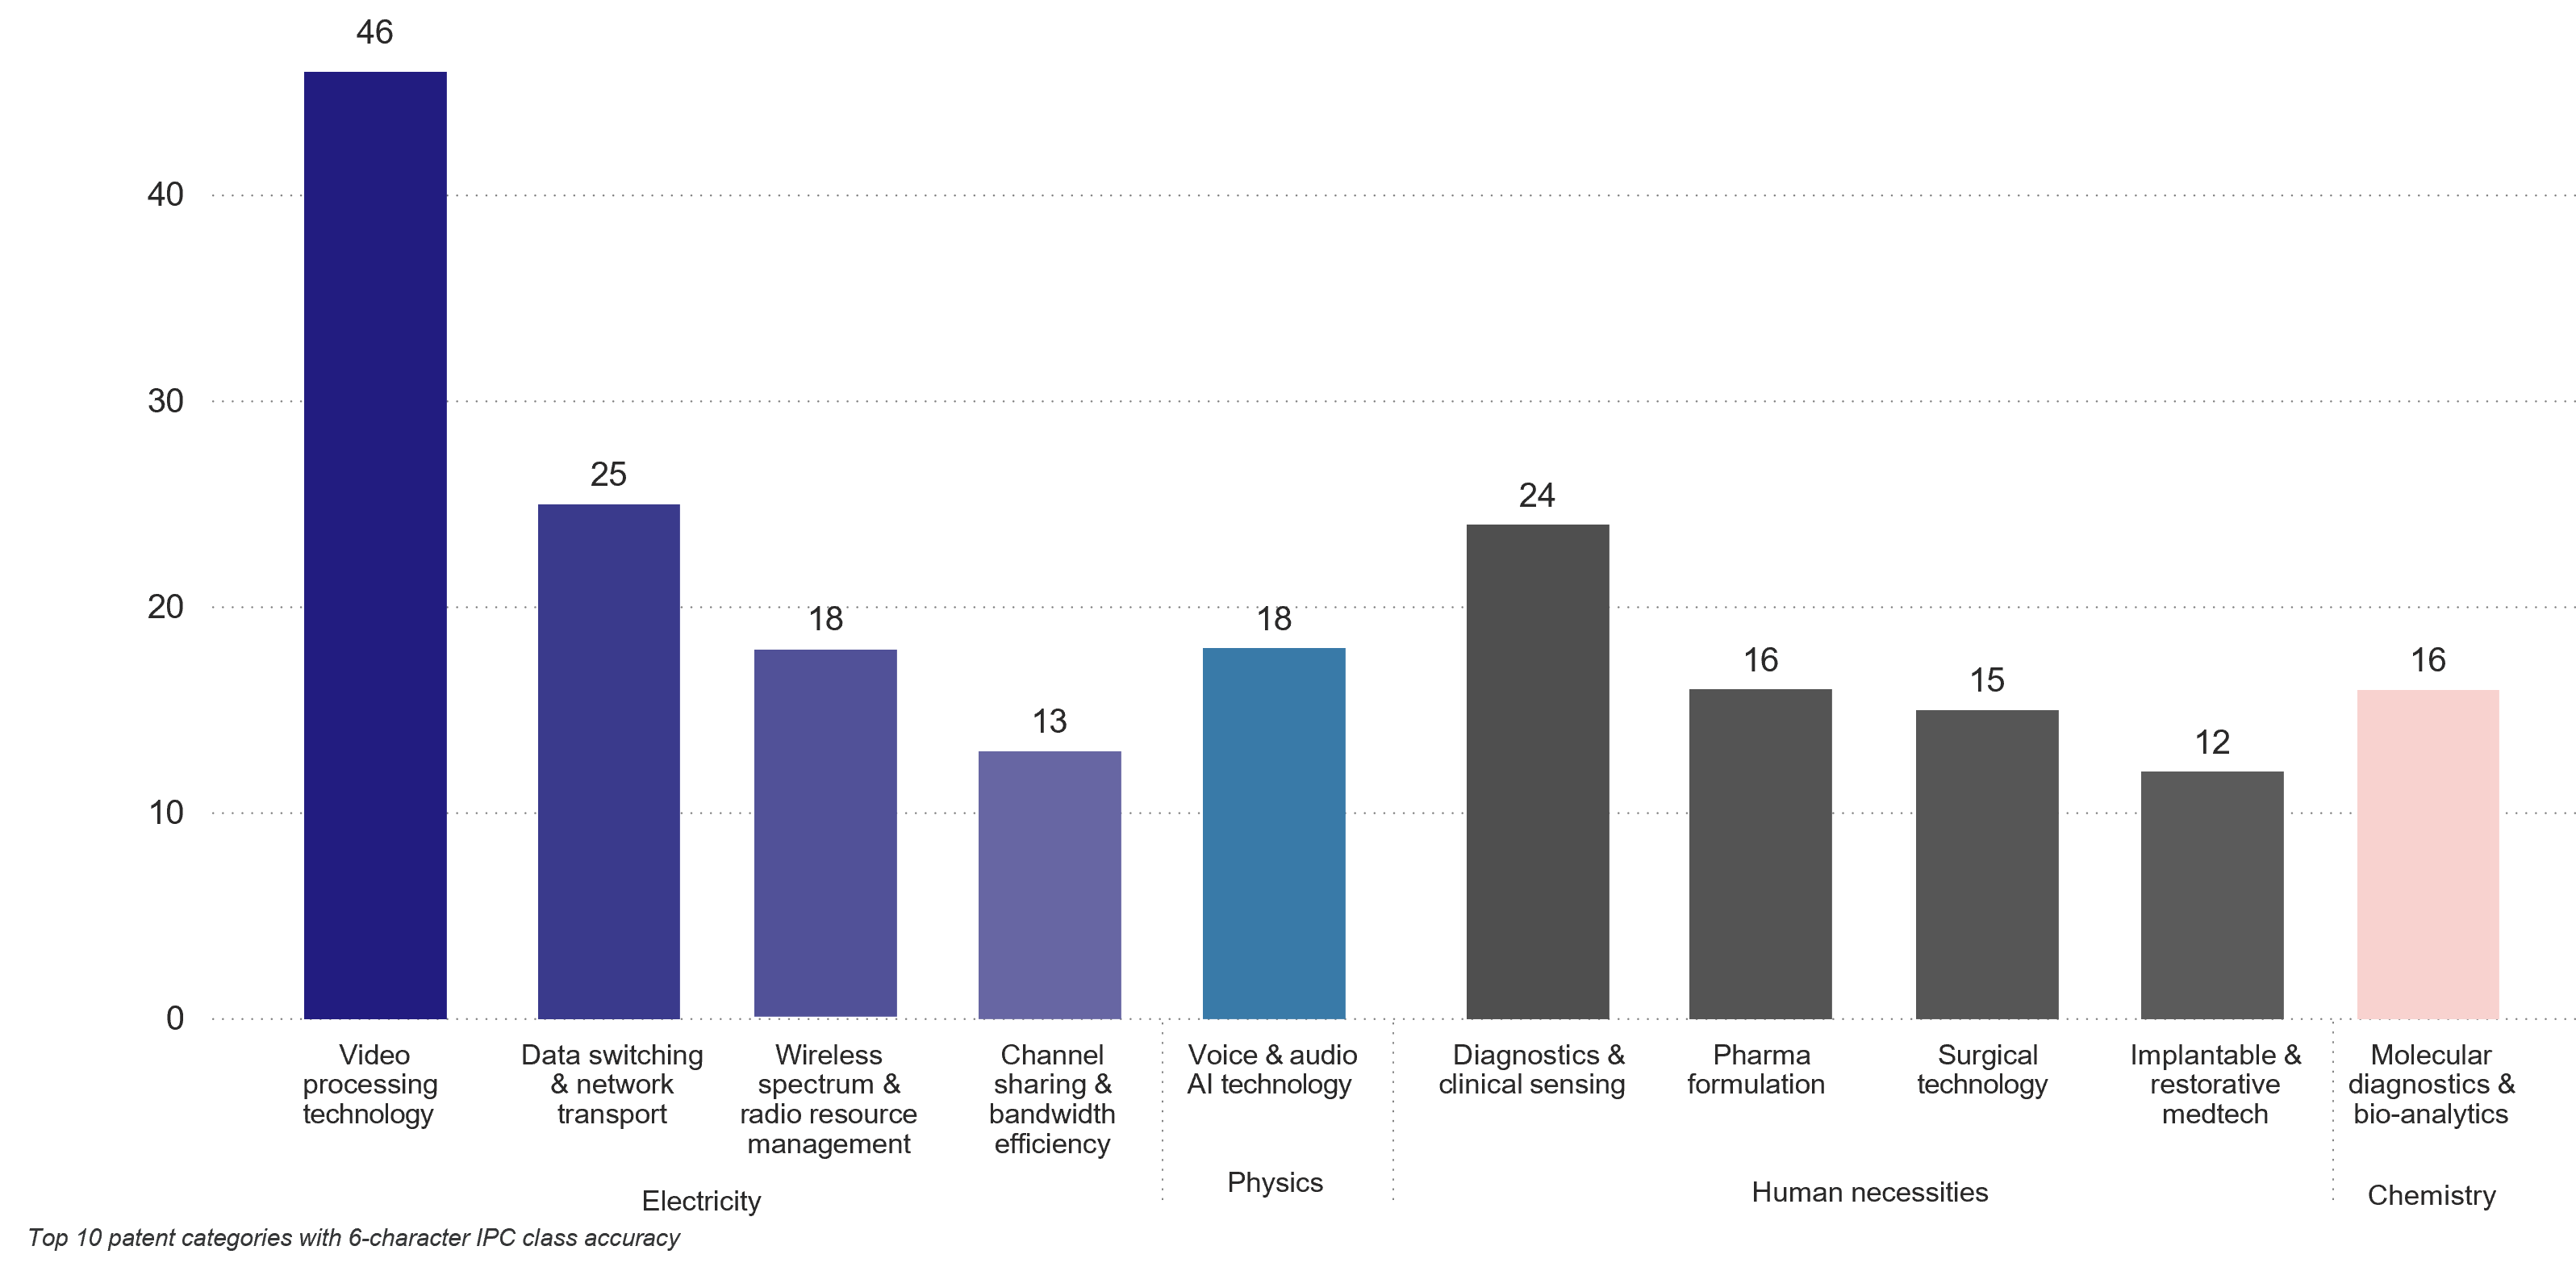
The distribution across four IPC sections confirms that the UPC is not functioning as a single-sector court. While telecommunications and digital media dominate by patent count, substantial litigation is also present in pharmaceutical and medical technology sectors.
5. Claimants' choice of Local Division
5.1 Methodology and scope
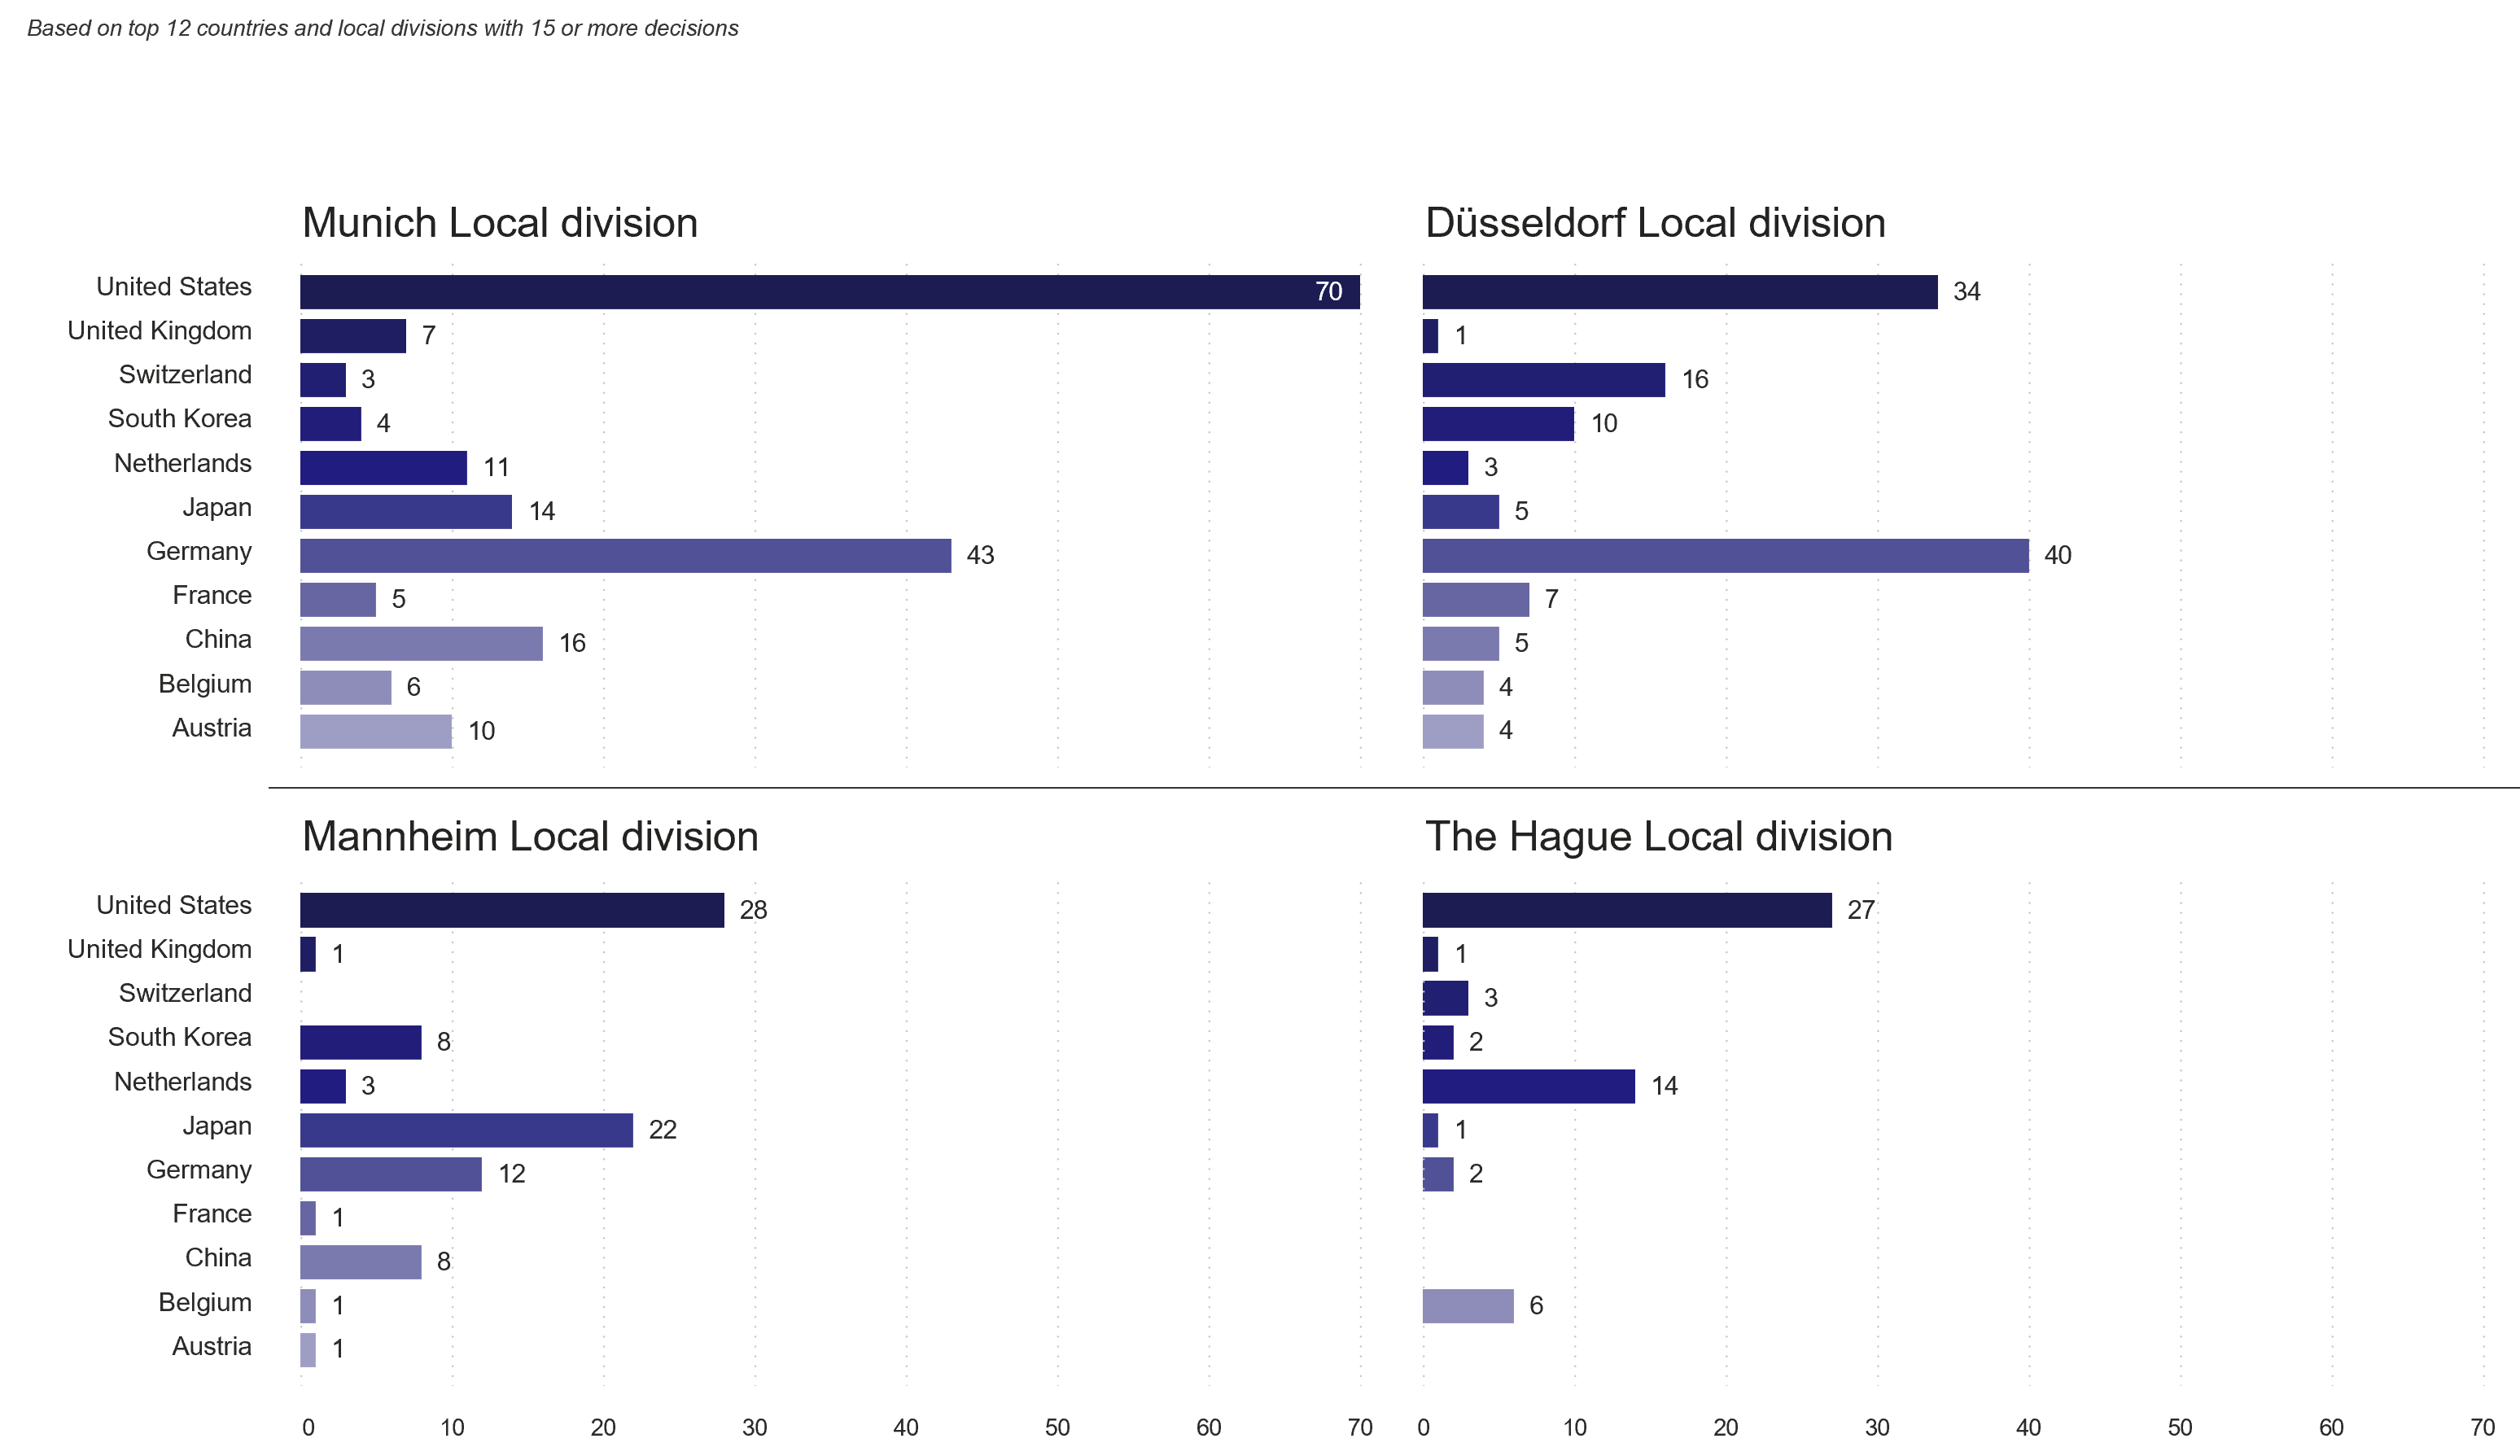
The analysis on choice of division investigates whether there is a pattern between the country of origin of the claimant and the Local Division of choice. The analysis is based on the top 12 countries represented among all claimants and restricted to Local Divisions that have issued 15 or more decisions across all countries.
For the purposes of the analysis, claimants were aggregated under their corporate group. Volume metrics are calculated using unique combinations of corporate groups per case. For example, if a single proceeding involves two independent corporate groups, both are recorded in the count.
5.2 Local Divisions
Munich is the highest-volume Local Division in the dataset. Most cases are filed in Munich by US-based claimants, with 70 actions. German claimants account for 43 actions. With the exception of Mannheim, all German Local Divisions display a similar claimant profile, with US and German entities representing the two largest filing groups. In Mannheim, however, Japanese claimants ranked second with 22 actions, and German claimants ranked third.
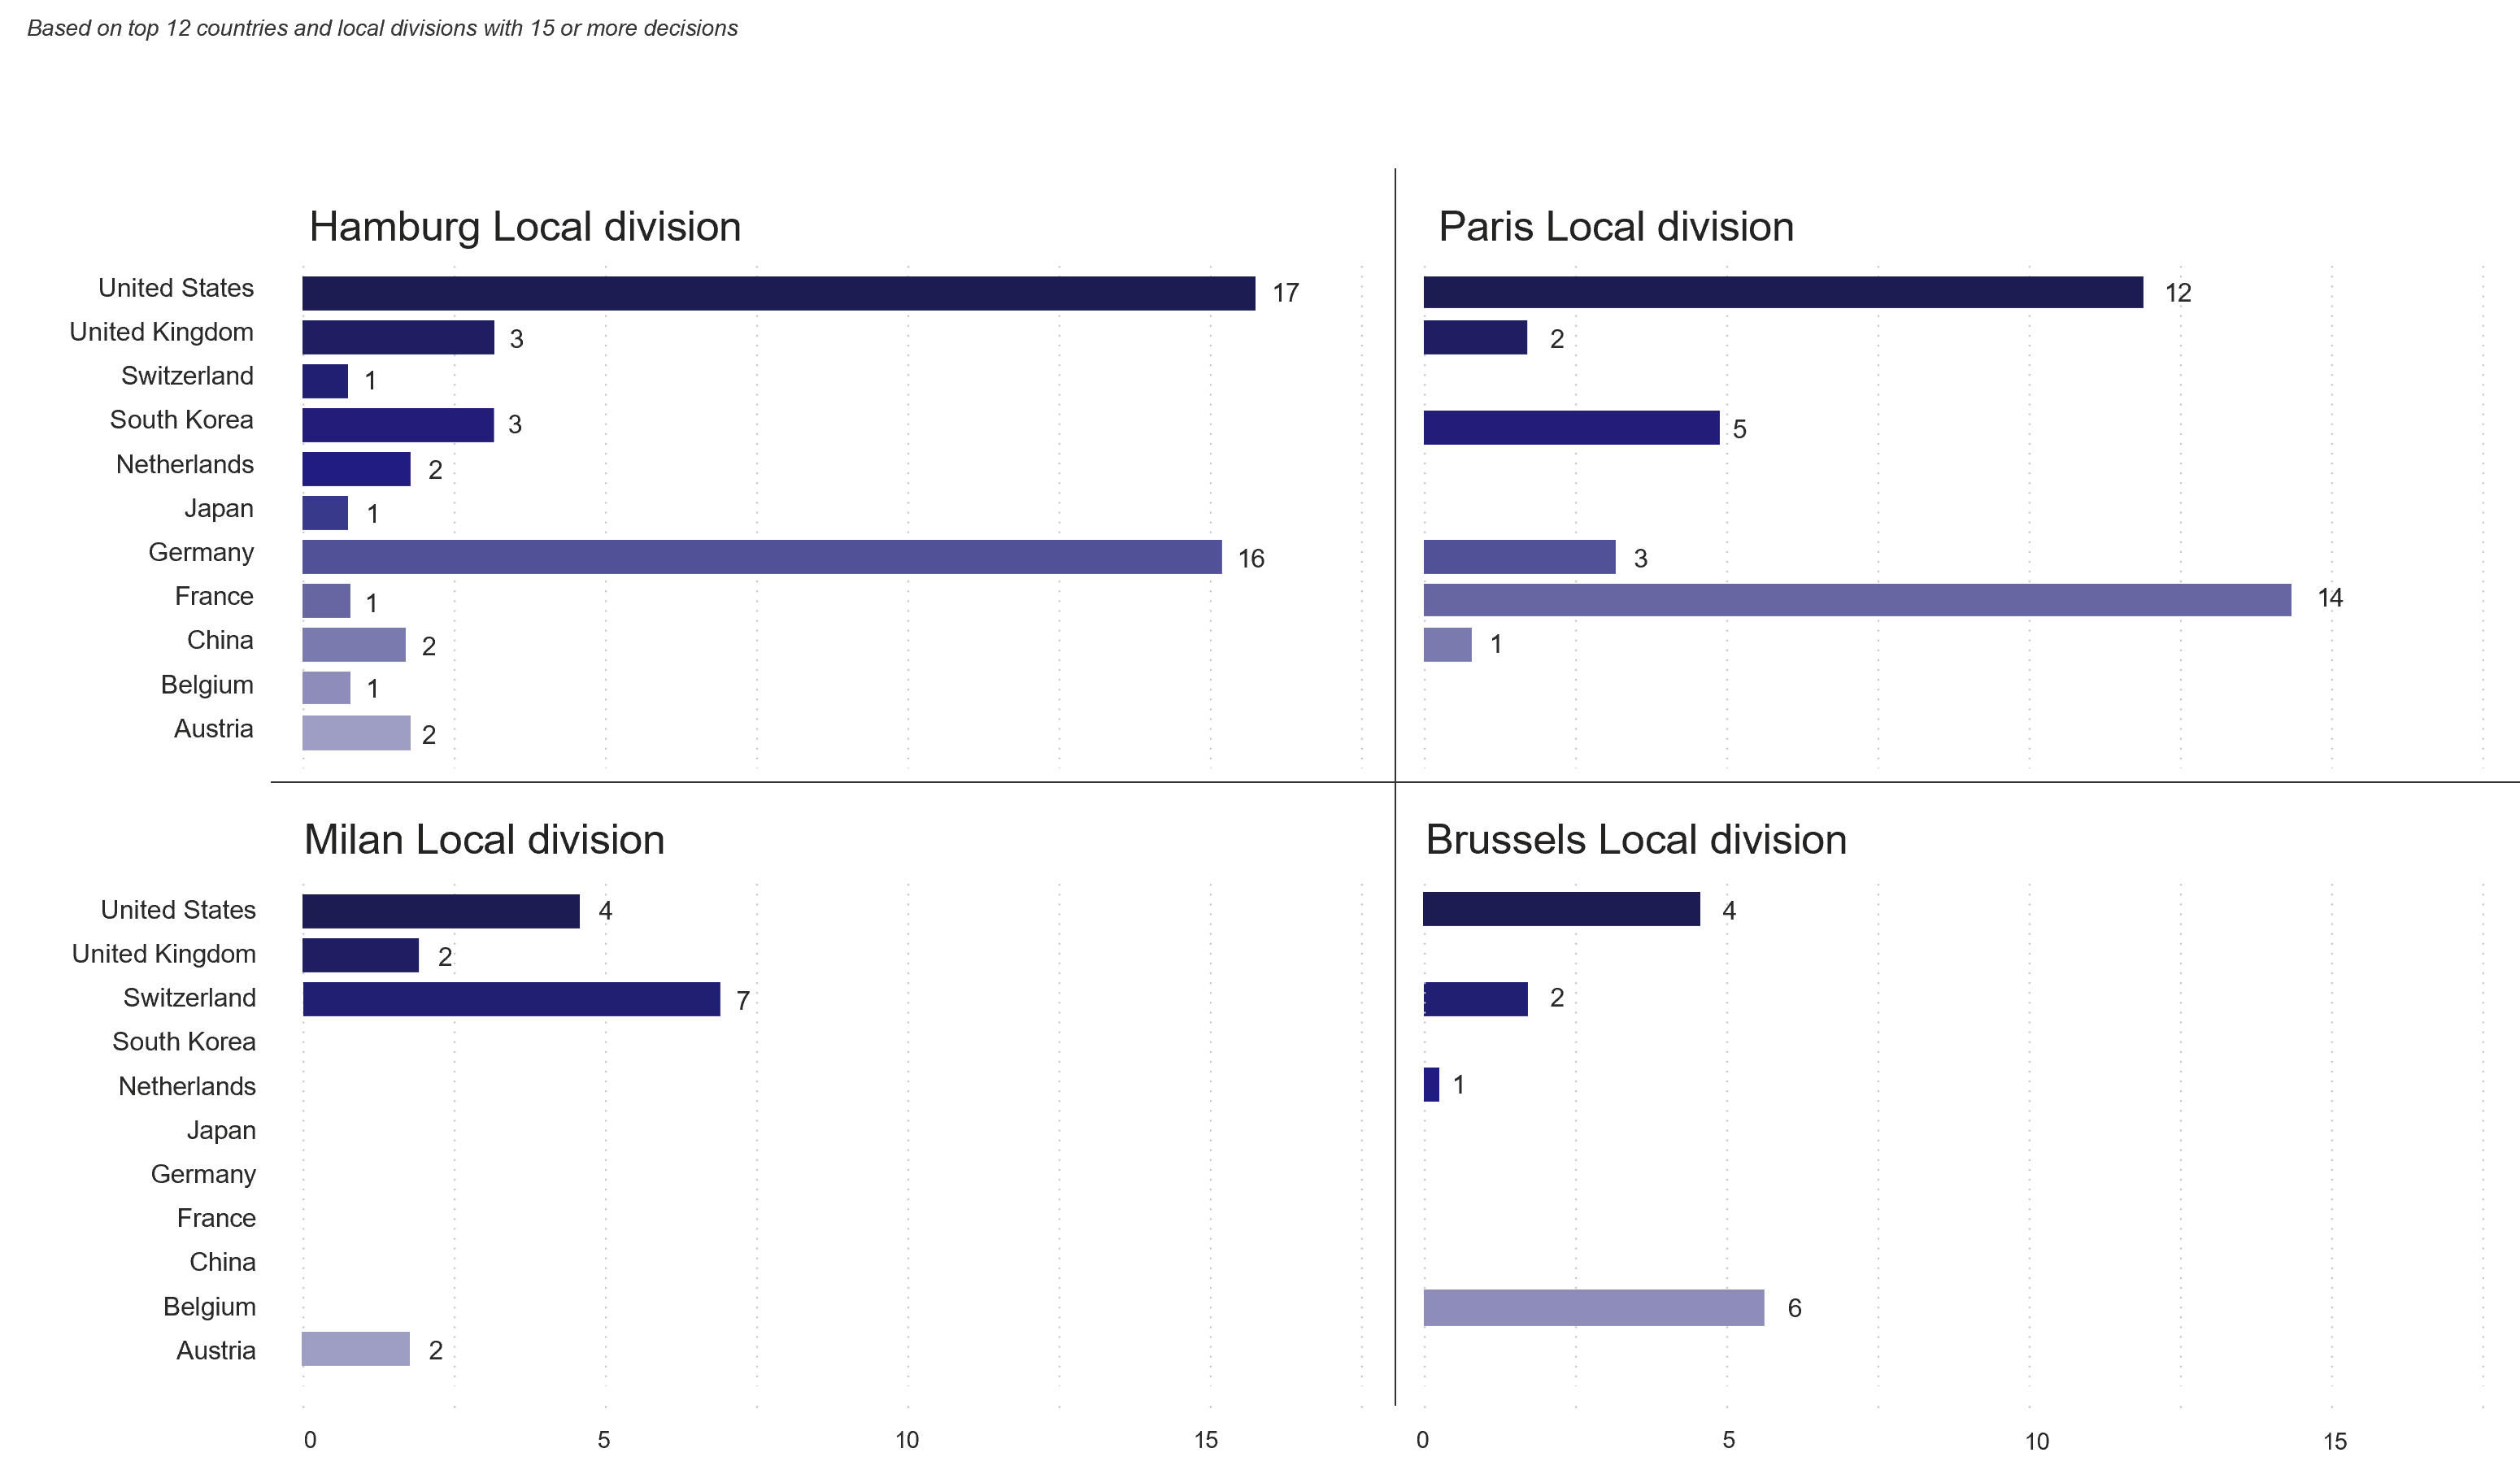
The Local Divisions in The Hague and Paris display nationality profiles that differ from the German divisions. In The Hague, Dutch claimants display a domestic preference and account for 14 actions, while US claimants constitute the largest filing group with 27 actions. In Paris, French claimants are the most frequent case filers, with 14 actions, followed closely by US claimants with 12 actions.
Milan, Brussels, Hamburg, and Paris currently record materially fewer filings than the four divisions in figure 5.1.
5.3 Forum choice
Of course, the choice for the right Local Division is driven by factors including the location of the defendant, the subject matter of the patent, the applicable procedural language or tactical considerations relating to the panel’s expected decision outcomes or timelines. These aggregated data therefore do not allow conclusions about why a specific claimant chose a particular division. In case you require more in-depth analysis on specific topics, contact us.
6. Discussion and conclusions
The most active claimants are predominantly headquartered outside Europe. They sometimes litigate through European legal entities. The concentration of cases in electronics and electricity-related technologies reflects with the prominence of entities from the telecommunications sector among the most active claimants, while the range of industries represented still confirms that UPC litigation extends beyond a single technological field.
The defendant data shows that the UPC is primarily used to enforce patents against companies operating within the European market, with European entities accounting for 72% of defendants.
Altogether, the data indicates that the UPC attracts substantial participation from non-European right holders.
The Division data shows that Munich is the most frequently used forum and is particularly popular among US and German claimants. Japanese claimants are well-represented at the Mannheim Local Division.
Data Note
The statistics in this report are derived from publicly available decisions on the UPC Registry as compiled in March 2026. Where applicable, entities belonging to the same corporate group are aggregated under a single claimant name. The division-choice analysis is limited to local divisions with 15 or more decisions, based on the top 12 claimant countries. All data is collected and published by HOYNG ROKH MONEGIER.
Annex